US solar maintenance costs plummet as tech gains multiply
Inverter gains, remote technologies and improved cleaning strategies are cutting solar maintenance costs and new operations-focused plant designs should create further savings, Andy Walker, Senior Research Fellow at the National Renewable Energy Laboratory (NREL), told New Energy Update.
Related Articles
A recent study of U.S. PV costs shows that design and operational innovations are having a significant impact on operations and maintenance (O&M) costs.
Capital cost reductions and a gradual removal of solar subsidies have increased the importance of O&M efficiency. Developers are seeking to use economies of scale and the latest technologies to drive down operational costs and lower the levelized cost of energy (LCOE).
US solar system cost benchmark 2010-2018
(Click image to enlarge)

Source: National renewable energy laboratory, Nov. 2018
One-axis tracker utility-scale PV O&M costs fell from $20/kW/year in Q1 2017 to $14/kW/year in Q1 2018, including inverter replacement costs, the National Renewable Energy Laboratory (NREL) said in its latest annual U.S. Solar Photovoltaic System Cost Benchmark report.
Fixed tilt utility-scale PV O&M costs fell from $17/kW/yr in 2017 to $13/kW/yr in 2018, the study said.
Without inverter replacement, utility-scale fixed tilt O&M costs were $9.1/kW/yr in 2018 while tracker costs were $10.4/kW/yr.
NREL used a bottom-up approach to costs and the 2018 study incorporated greater granularity and improved cost estimation models.
This greater detail shows how new technologies and maintenance strategies are increasing maintenance efficiency and reducing labor costs, Walker told New Energy Update.
Further cost reductions are expected in the coming years as developers deploy improved plant designs which generate operational savings, he said.
Clearer view
NREL's O&M cost estimates now include assumptions on preventative and corrective maintenance procedures, based on real failure data.
A model is used to quantify preventative maintenance scheduled at regular intervals as well as corrective repairs to components. Corrective maintenance costs are calculated by multiplying the replacement cost, including labor, by the probability that a failure will occur each year.
The study breaks down O&M costs into six cost categories, shown in the table below. Inverter replacement costs comprise the lion’s share of component replacement costs on utility-scale projects. Module cleaning is the second-largest cost, unlike on residential and commercial projects.
US solar O&M costs by category (2018)
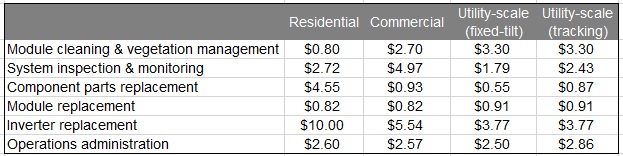
Source: National Renewable Energy Laboratory.
Improved inverter reliability has been a key driver of lower O&M costs and suppliers are offering much longer warranties.
“Inverters have improved both in terms of topology and the quality of components,” Walker said
Improvements such as better protection of working electronics from the environment and materials which lower leakage current and series resistance could see inverter lifespans hit 25 years, he said.
A number of other technology advancements have created additional savings. Remote sensor and access technologies, including drones, have sped up monitoring procedures, Walker said.
“Previously you had to have staff with personal protective equipment (PPE) and training/certification do circuit-by-circuit testing of live circuits,” he said.
Predictive analytics improvements have reduced faults and increased plant efficiency while more companies are collaborating on spare parts warehousing to optimize deployment, Walker noted.
Improved plant cleaning strategies, including advanced cleaning technologies and schedule optimization programs, have also improved efficiency, he said. In one example, operators in agricultural areas have placed greater focus on cleaning after the ploughing and pollen seasons to increase plant efficiency.
Tracker systems have additional maintenance costs because they have moving parts, such as gearboxes, drivelines and central monitoring systems.
Tracker suppliers are continuing to improve durability and accessibility to optimize O&M.
In one example, Array Technologies has developed a single-axis tracker designed to operate within a temperature range of -34C to +60C with simplified engineering to minimize failure points.
Further savings
Solar project developers will face sustained price pressure in the coming years. The investment tax credit (ITC) steps down from 30% for PV projects starting construction in 2019, to 10% from 2022 onwards. Falling subsidies and competition from wind and gas plants will prompt PV operators to seek out further savings and longer plant life spans.
Solar O&M costs will continue to fall as developers place more emphasis on the full lifespan of the project and incorporate operational learnings in plant designs, Walker said.
“Up to now designs favor low initial costs and foist operating costs on someone else,” he noted.
Advanced designs will include improved site water run-off measures, better wire management and enclosure types, and the use of elevated equipment pads, Walker said.
These design improvements could have a significant impact on O&M costs over the lifetime of the plant, Walker said.
“I think a target cost of $10/kW/year is an achievable goal...I hope we get there in five years”, he said.
New Energy Update