Record US solar market values point to new build openings
The value of solar varied widely between U.S. markets in 2022, highlighting new project opportunities for developers able to control supply risks, industry experts said.

Related Articles
U.S. solar market values hit record highs last year on the back of soaring gas prices, supporting the business case for solar amid volatile market conditions.
The average wholesale market value of solar projects climbed 40% to $71/MWh, based on local electricity prices and capacity values, but high gas prices created a wide gap between markets, the Lawrence Berkeley National Laboratory (Berkeley Lab) said in its latest utility-scale solar report. U.S gas prices almost doubled to $6.42/million Btu last year and higher power demand supported prices in some markets.
The highest solar value was $108/MWh in the Duke Energy Florida market, where solar represents just 5% of annual load and high-cost peaking gas generation is required, Berkeley Lab said.
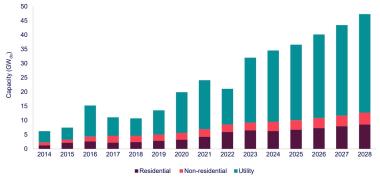
Forecast US solar installations
(Click image to enlarge)
Source: Wood Mackenzie, September 2023
The lowest value was $51/MWh in California's CAISO market, due to a high penetration of solar power. The regions with below-average solar market value were mainly in the West plus the Texas ERCOT and eastern ISO-NE markets, where solar’s market share is generally higher.
The solar market values will be important to developers seeking new opportunities during a high growth period for renewable energy. Solar installations are expected to hike 53% this year to a record 32 GW as supply concerns ease and developers embrace new tax credits in the 2022 Inflation Reduction Act. Most new solar projects include battery storage as rising solar capacity dampens daytime prices and developers seek to shift power to more valuable evening peak hours.
High solar values could entice developers into markets that were previously uneconomical due to lower solar yields, challenging terrain or higher interconnection costs, a spokesperson for developer Enfinity said. Enfinity operates 400 MW of U.S. solar capacity and is developing projects in a number of states.
Forward gas prices will remain a key factor in assessing price risk, the spokesperson noted. The U.S. Energy Information Administration (EIA) predicts gas prices will slump to $2.61/million Btu this year and rebound slightly to $3.23/million Btu in 2024 while futures prices at the Henry Hub benchmark currently firm over the medium term.
The long-term gas price will prove key but over time rising solar, wind and storage penetration will weaken the link between gas and electricity, at different rates according to market fundamentals.
Markets with high solar values and low barriers to entry may attract solar developers but states can also spur demand through renewable portfolio requirements, Joachim Seel, Policy Researcher at Berkeley Lab’s Energy Markets and Policy Department, noted.
"Overall we would expect solar values to become more similar across regions as the markets mature," he said.
Selling solar
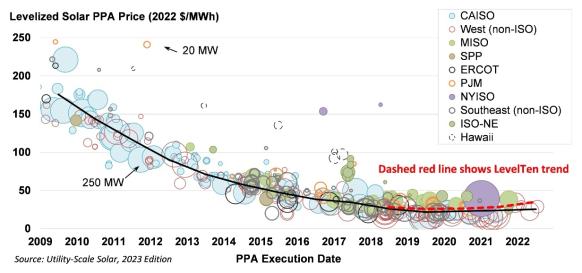
The rising market value of solar last year outstripped rises in the price of solar power purchase agreements (PPAs), helping to attract offtakers, Berkeley Lab said.
Solar PPA prices rose in 2020-2022 as developers navigated inflation challenges and global supply chain issues.
High inflation and interest rates “had a significant effect in the market by lowering levered returns and increasing investor return expectations overall,” the Enfinity spokesperson noted.
US solar power purchase agreement prices by market
(Click image to enlarge)
Source: Berkeley Lab, LevelTen Energy
While PPA prices climbed in 2022, the average cost of installing U.S. utility-scale solar projects continued to fall.
The levelised cost of utility-scale solar fell slightly to $39/MWh, Berkeley Lab said, but wide gaps opened between projects. Larger developers were able to minimise the impact of higher supply chain and financing costs, while smaller developers generally incorporated higher costs, investment bank Lazard said in a report published in April.
Levelised costs ranged from $24/MWh to $96/MWh on an unsubsidised basis, compared with a range of $30/MWh to $41/MWh for crystalline solar panels in the last report in 2021 and $28/MWh to $37/MWh for thin-film, Lazard said.
U.S. solar mergers and acquisitions (M&A) have been picking up as developers seek the cost advantages of scale during a period of high growth.
Competitive future
Solar PPA prices fell in the second quarter of 2023 and industry experts predict rising deployment rates, tax credits and an eventual retreat in interest rates will put downward pressure on solar power prices in the coming years.
The Biden administration's Inflation Reduction Act has catalysed solar development since it was signed into law in August 2022 and new tax credits are steering developers into new markets. Developers gain extra credits for using local manufacturers and many are looking to build in former coal communities and low-income areas to take advantage of additional incentives.
Going forward, Enfinity predicts ongoing volatility in interest rates, supply chains, labour markets and gas prices, exacerbated by ongoing geopolitical crises.
As U.S. solar demand soars, project partners will need to lock in the supply of solar components and labour, the spokesperson said.
Developers need to “strategically position themselves to avoid supply shortages,” the spokesperson said.
Reporting by Neil Ford
Editing by Robin Sayles


