The Yoyo Economy – Around The World We Go
Article by John Wagner Jr from Wagner Logistics published on July 2nd

While the stock market resembles a yoyo with investors worried about the Fed dialing back support of the economy, there are positive signs that the economy continues its slow improvement. There are also some key indicators we keep an eye on, knowing the Fed is watching employment and inflation closely.
For those of you involved in the supply chain industry, we watch these economic factors because retail sales and manufacturing drive the transportation industry. Supply and demand are especially important now as concerns over trucking capacity grow.
 On the positive side of the U.S. economic ledger, the Labor Department said fewer Americans filed for unemployment benefits as claims fell by 12,000 to 334,000 in the week ending June 8.
Unemployment applications fell to a five-year low of 327,000 in late April and the four-week moving average dropped to 345,250 from 352,000.
There was more positive news, with the Commerce Department reporting that retail sales beat the forecast in May rising 0.6 percent, the biggest increase in three months.
Cars and light truck sales drove much of the gain with a 1.8 percent increase in May, equal to an annual rate of 15.2 million units. Retail sales were up 4.3 percent year over year for the month.
Other gains included building materials (up 0.9 percent), food and beverage (up 0.7 percent), health and personal care (up 0.2 percent), sporting goods stores (up 0.6 percent), general merchandise (up 0.5 percent), non-store retailers (up 0.7 percent) and miscellaneous retailers (up 1.2 percent).
Retailers selling big-ticket items like furniture, electronics, department store wares and other discretionary items were disappointed. Gas sales slipped in May, falling 0.2 percent.
Excluding autos, retail sales rose only 0.3 percent so it is hoped that with the manufacturing numbers falling, consumer confidence will keep this weak economy moving forward in retail sales. After all, the University of Michigan's Consumer Sentiment Index hit its highest level since July 2007.
Why so optimistic?
I see it as a combination of low inflation, a growing housing market, a positive stock market and more moderate gasoline prices.
The Institute for Supply Management monthly services index increased to 53.7 from 53.1 in April. Any reading over 50 indicates expansion and lower than 50 shows contraction. ISM’s services index measures non-manufacturing components of the economy including transportation, retail sales and financial services. The services side of the economy makes up two-thirds of the U.S. gross domestic product.
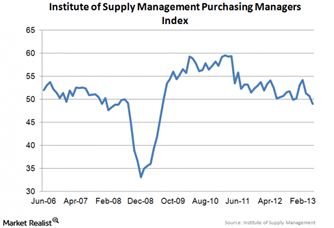 On the negative side of the ledger, the ISM also reports that manufacturing activity dropped to its lowest level in almost four years. The institute's Purchasing Managers Index fell 1.7 percentage points in May to 49 percent. A reading below 50 indicates the manufacturing economy is contracting. This is the first time since November that the index has dipped into negative territory.
One explanation is that sales have been affected by cutbacks in government spending, higher taxes and weaker economic growth in Europe, resulting in manufacturing growth of only 1.3 percent in the last 12 months.
In transportation
As LTL capacity utilization improves, rate increases are sure to follow. UPS Freight, the less-than-truckload unit of UPS Inc., increased rates 5.9 percent June 10.
LTL carrier ABF Freight System also raised its rates 5.9 percent at the end of May and FedEx Freight is raising rates by 4.5 percent in July. Con-way Freight will raise its less-than-truckload rates 5.9 percent on June 24.
The Department of Transportation’s freight transportation index was up 1.2 percent in April year over year but fell 1.2 percent from March. Truckload capacity appears balanced now as we await the hours-of-service changes on July 1. The Cass Shipments Index shows truckload volume down 3 percent for the year.
The Association of American Railroads reports that U.S. rail intermodal traffic rose 2.5 percent in the week ending June 8 when compared to the same week in 2012. Year-to-date intermodal traffic is up 4 percent to 5.5 million units.
Carload traffic declined 2.8 percent for the week with five of 10 carload groups up, led by petroleum products (up 27.8 percent).